Time
- 2013 – present
Role
- Concept
- UX Design
- UI Design
- Frontend Development
The idea to this project was born soon after I started using WhatsApp on my first iPhone. I noticed the app's option to send chats in a structured format via email and immediately had the idea to visualize this data in some way.
It took several years before a course about the Lean Startup methodology at university offered the perfect opportunity to start developing the concept – and to apply the Lean Startup principles to it.
A long running smoke test revealed the demand for such a tool and the stable usability and positive user experience of the concept.
I started developing the application together with a programmer friend in 2015 and it went online at the end of the year.
It became a huge success and the application has now served over 60.000 WhatsApp chat visualizations for people and organizations around the world.
So what is it, actually? The concept
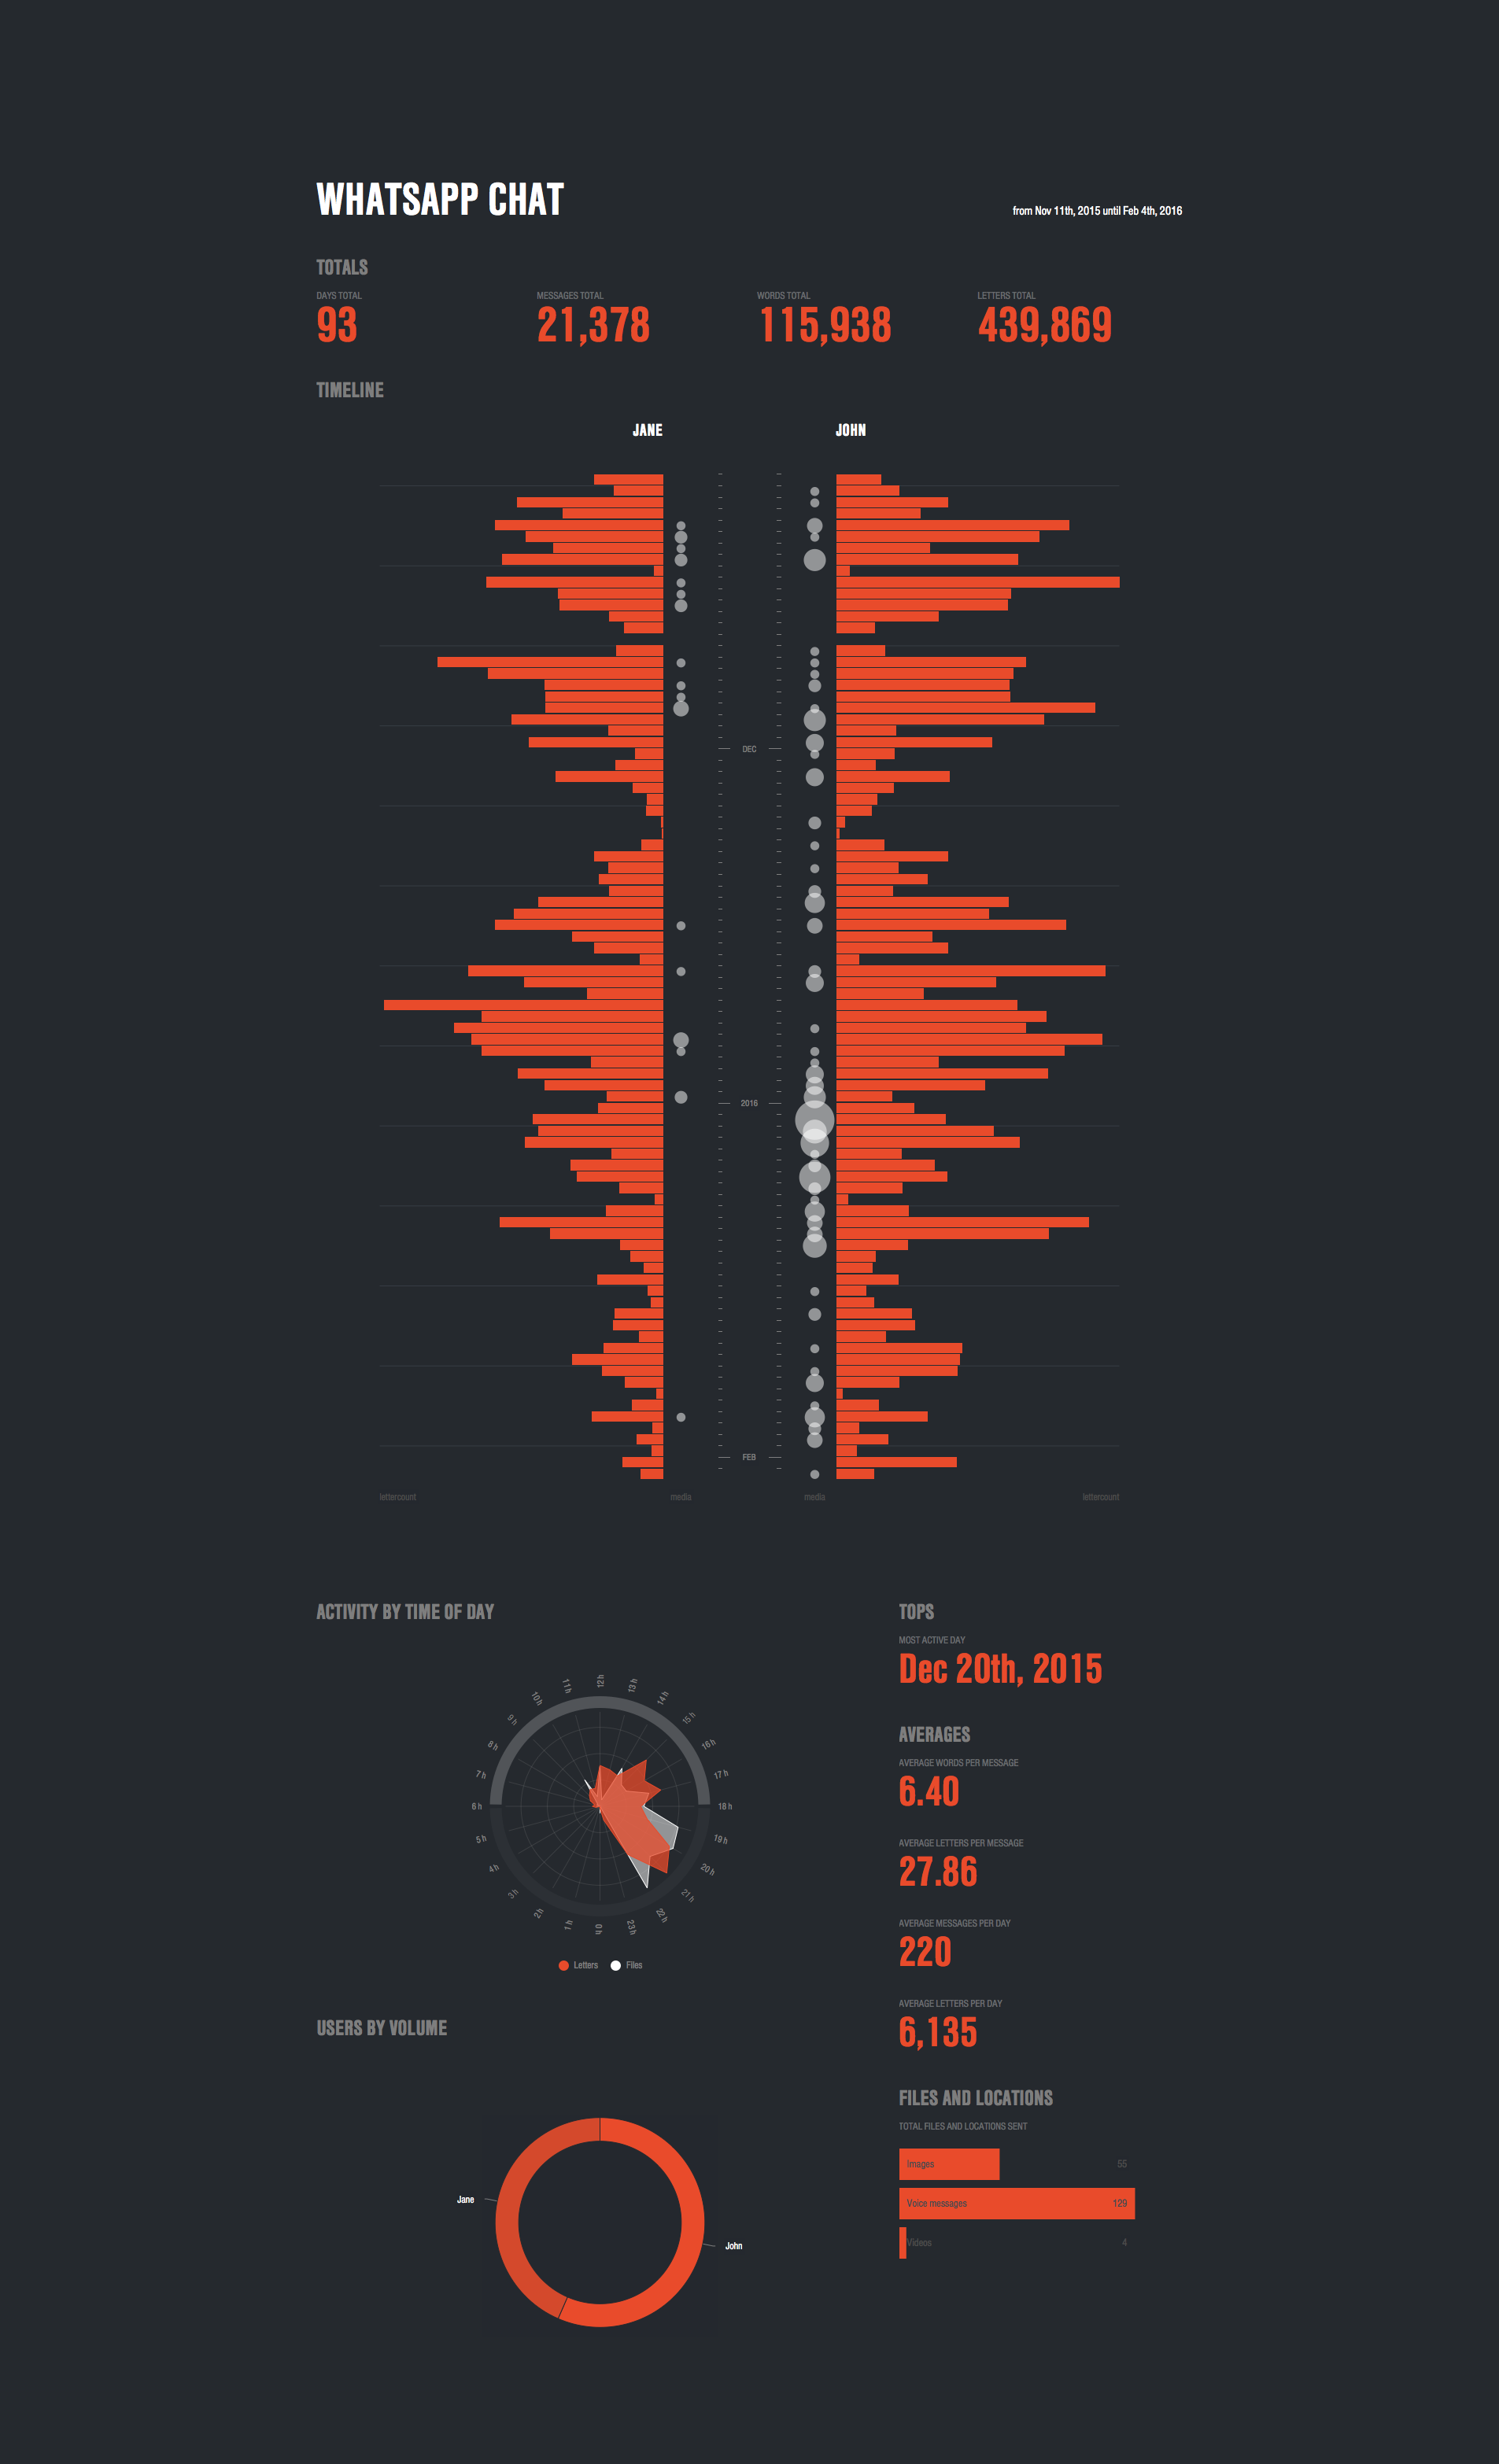
Taking advantage of WhatsApp's functionality to export and mail chats, Chatvisualizer is visualizing data based on conversations. It is providing insights about activity, participation and data sharing.
The web application is able to receive chat files, transform and enrich them generating a unified format. The visualizations are made available through a secure web page.
Build, measure, learn Lean Startup Approach
A course about "Lean Startup" in my Interfacedesign studies in 2013 required to put the methodology into practice. Learning about the "build, measure, learn" cycle and the principles and methods, I was hooked and immediately had my Chatvisualizer (still unnamed at that time) concept in mind.
Build
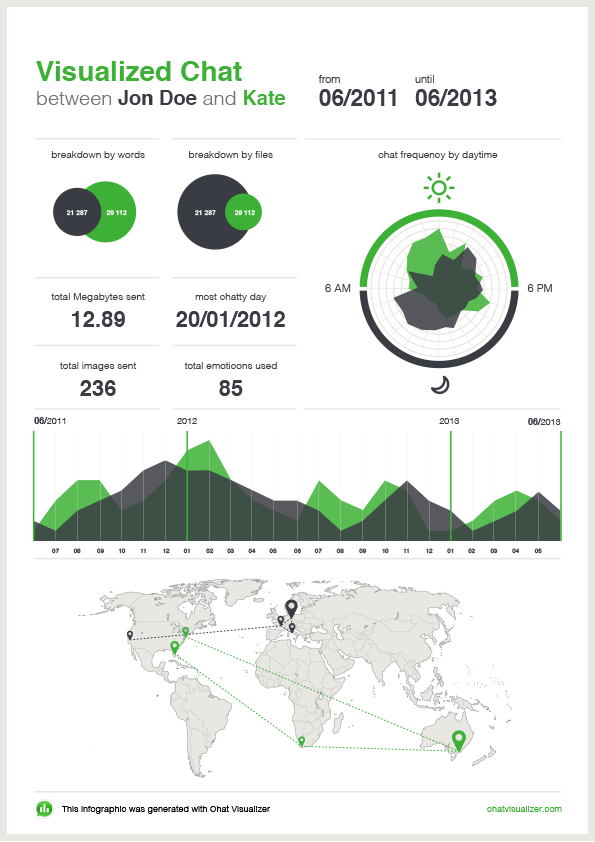
After deciding for a name (and web domain), I build a minimum viable product in form of a smoke test.
A smoke test is a method for determining if there is sufficient customer demand for a given value proposition of a product or service to justify building the actual product or service.
This was a website communicating the idea, workflow and features of the service. It was advertised on social media and by booking Google Ads.
Measure
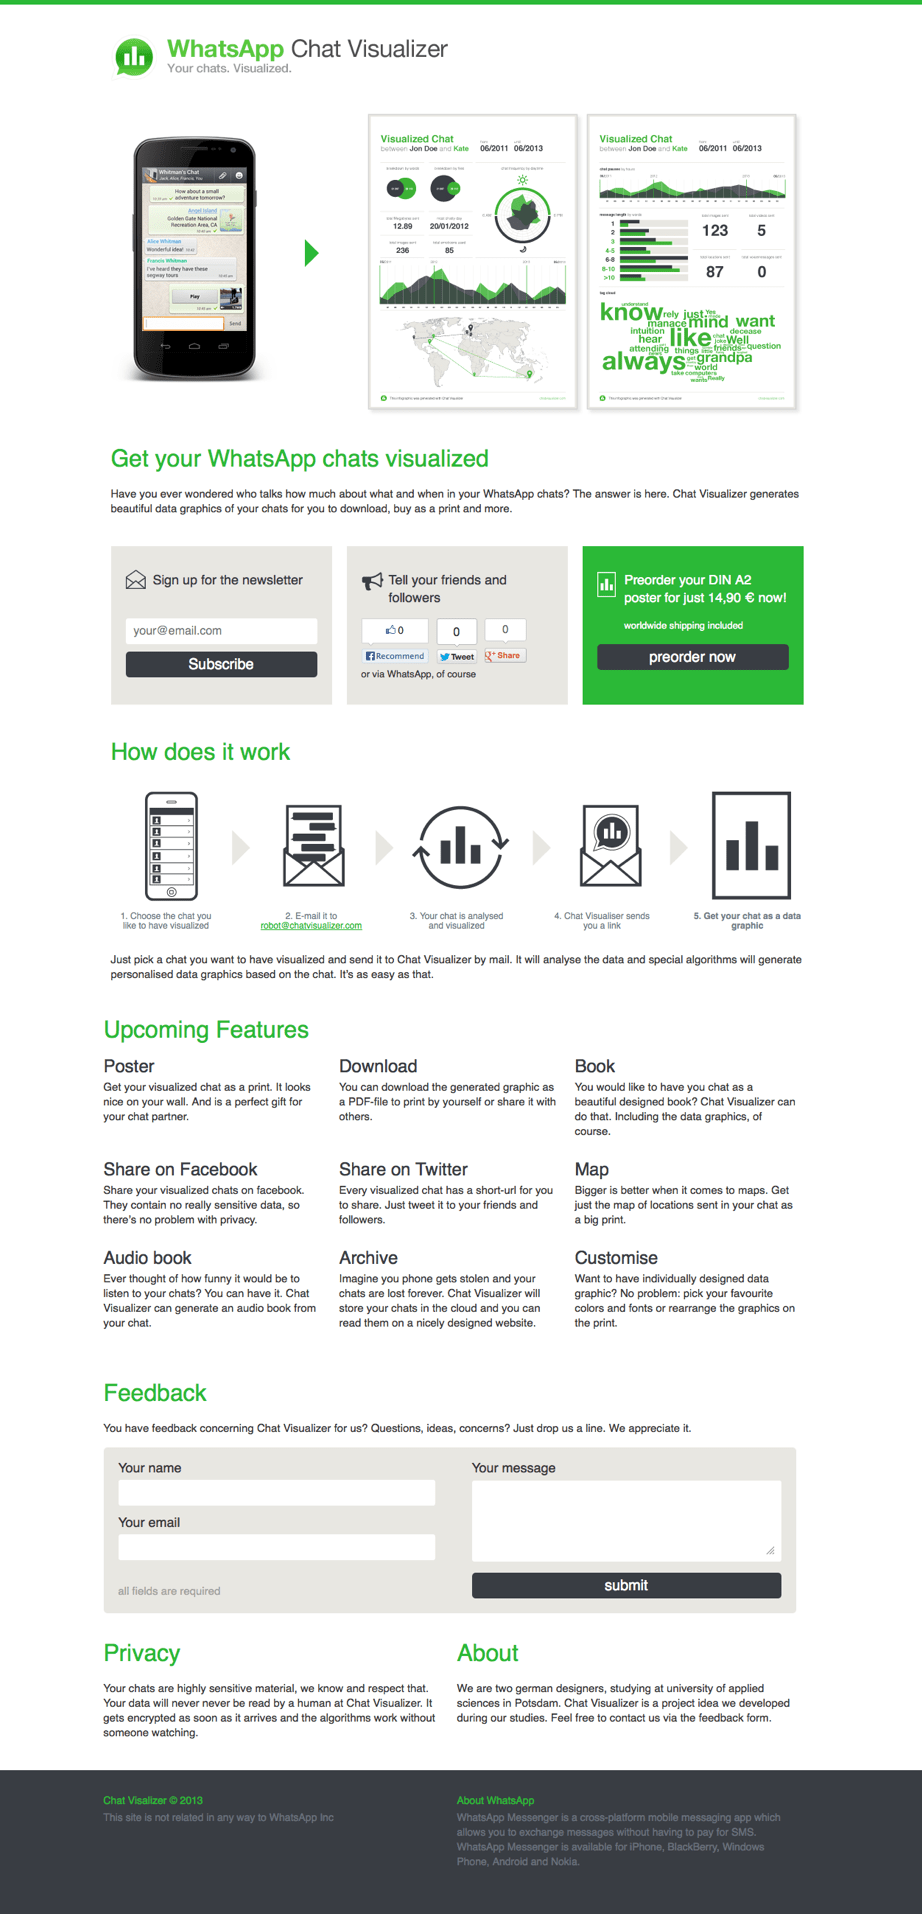
To learn – gather feedback – as much as possible, the website offered multiple ways for interaction and feedback and all of this was tracked and counted. I also already wanted to measure the demand of specific features I had in mind, so these were presented too.
Despite having Google Ads at the start it took some time to gather substantial visitor numbers and the necessary amount of validated learning. The smoke test went for many months, a lot longer than expected, but in conclusion it showed good results.
- feedback mails 5
- newsletter signups 6
- social media shares 0
- "buy print" button clicks 13
- received chats 52
- conversion rate (≈) 10%
The outcomes of the smoke test in short: People absolutely wanted to try the service by sending chats and an overall pleasantly high conversion rate. The interest in other options was marginal.
Learn
At the end of the measure phase, I had several learnings:
- People are not willing to share a product they could not try out – social media share buttons proved to be of no interest.
- Most people do not want to communicate their ideas, feelings or feedback about a product concept without trying it.
- There was an interest in the printed chat visualizations feature. A significant number of people clicked the corresponding button, and this feature was the main reason people gave feedback by mail.
- There was a demand. People wanted to try the product by all means. Despite making it clear, that Chatvisualizer was not a working product at the time, users sent in their chats, as described in the workflow part of the website.
- The onboarding and usability of the process was solid. Even though using Chatvisualizer required doing everything in WhatsApp and their email client initially, people ware able to do it. And they did.
- People were not too concerned about privacy issues to use the service. They rated the value of the service higher that possible privacy issues. This was a crucial learning.
Chatvisualizer gathered 52 chats by users. Which may not seem much at first sight, was significant considering relatively low visitor numbers and the fact that service was not working.
The learnings validated the concept and convinced me to develop Chatvisualizer into a working service.
Onboarding The Landingpage
Having a well designed landingpage was crucial for the success of the Chatvisualizer since "using" the service means starting the process in WhatsApp.
Workflow description
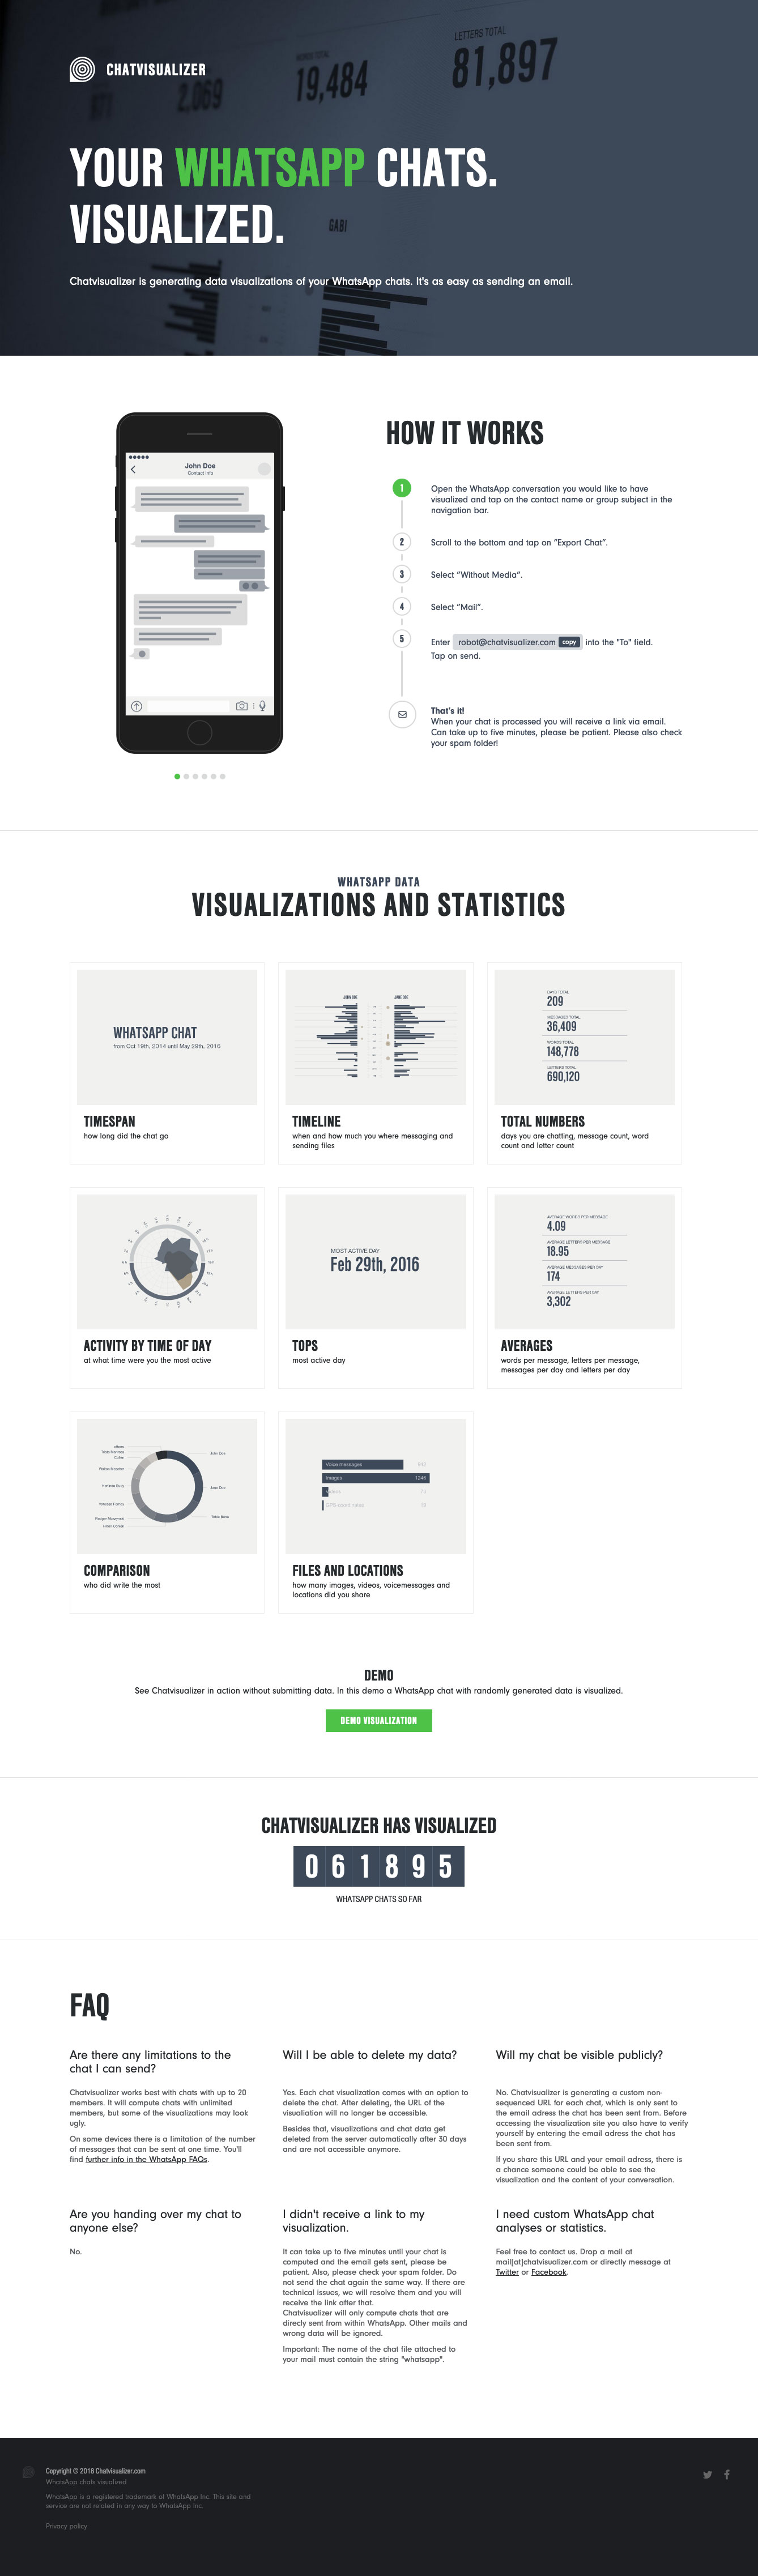
The smoke test revealed that displaying the procedure step by step was comprehensible and a good user experience. For the landingpage this section was improved by animating and describing the workflow with abstracted WhatsApp screens.
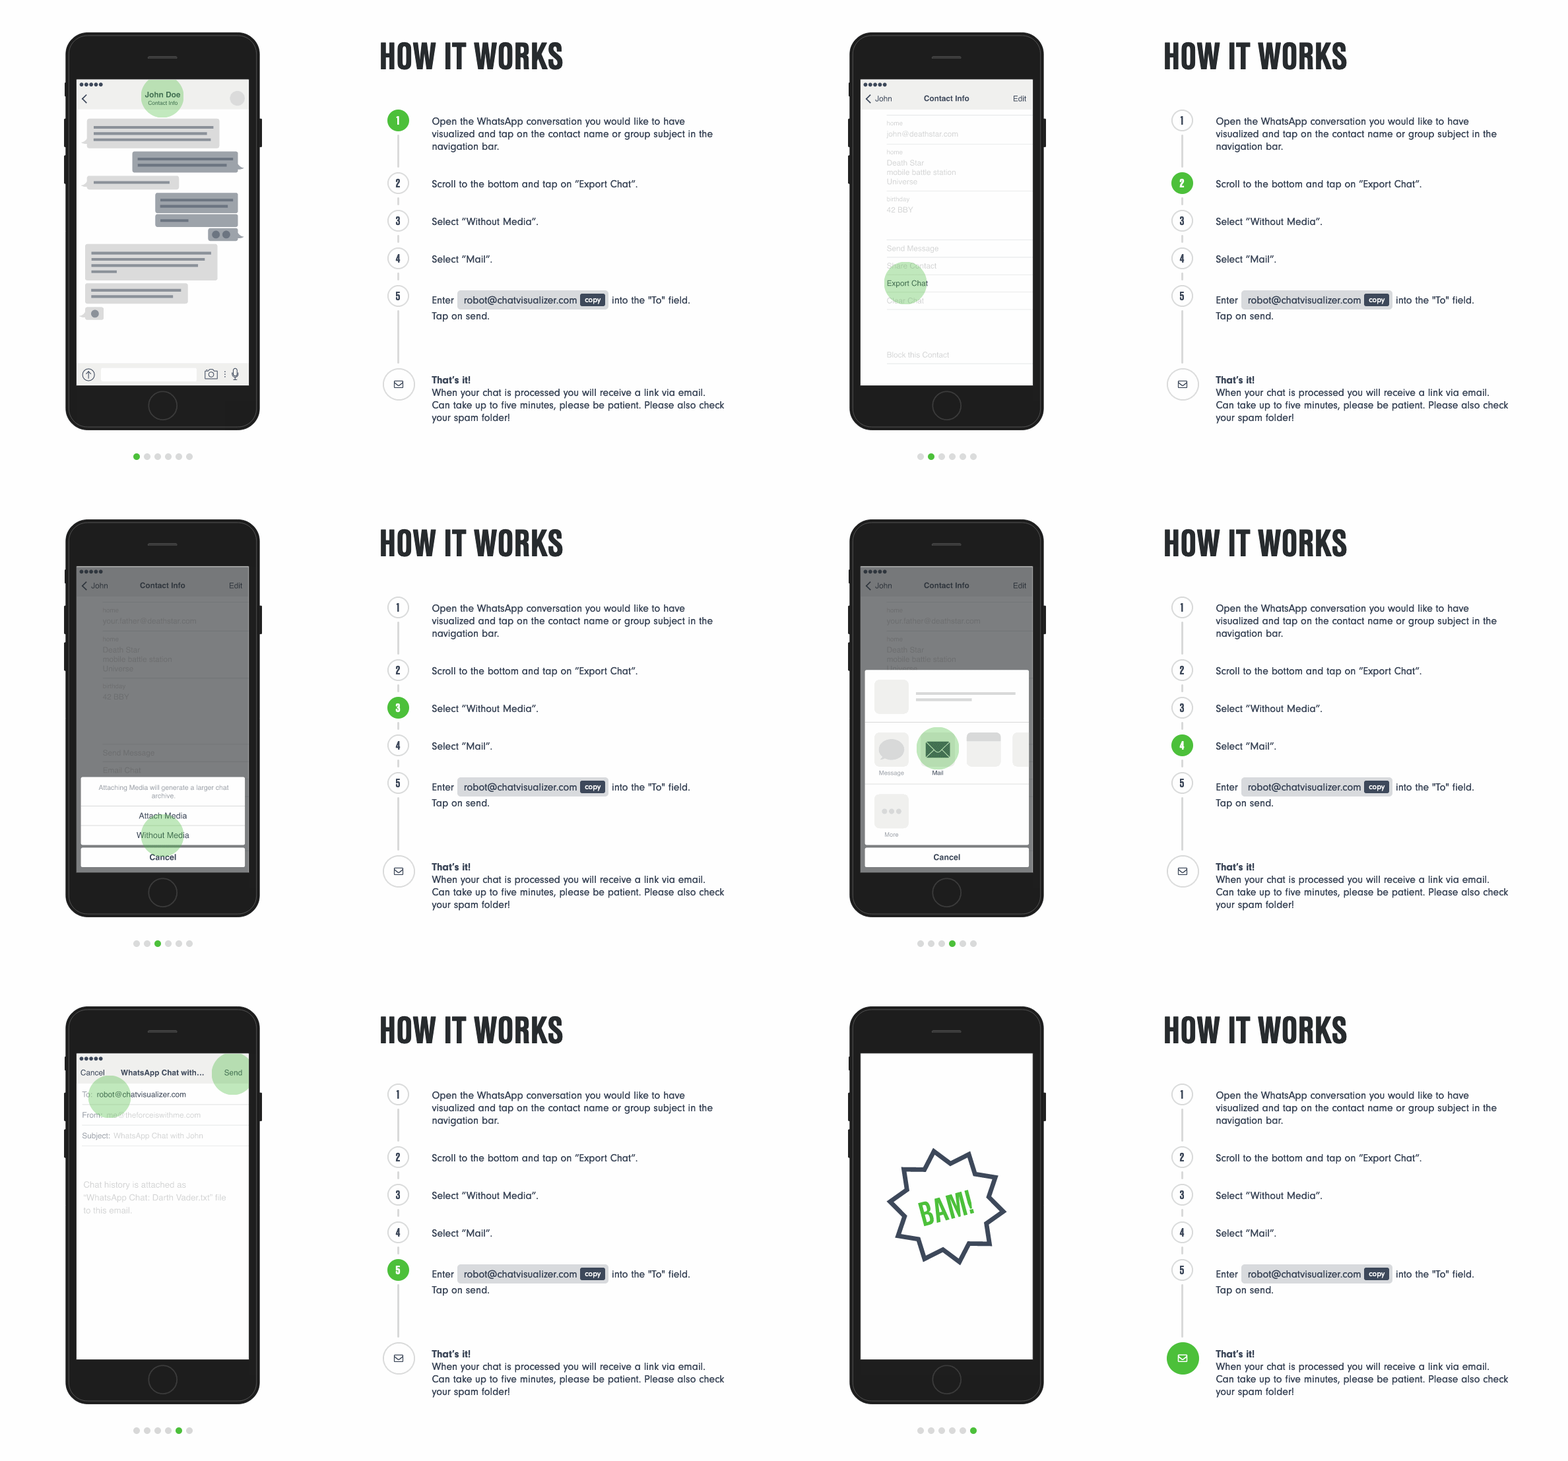
The concept is described textually and by displaying details of the final visualization. Feedback led to offering a demo visualization with generated data so visitors can have an impression of the result before submitting their own data.
Furthermore the landingpage is offering a FAQ, answering the most urgent questions.
How it works Technical background
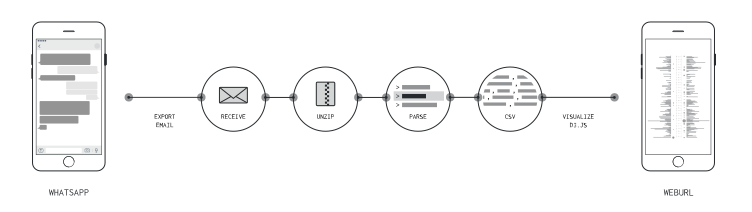
Chatvisualizer's main inbox at robot@chatvisualizer.com is constantly monitored for emails containing WhatsApp chats.
After a chat arrives, the attached file is separated from the mail, unzipped and the contained .txt file with the chat is parsed and transformed into a CSV file with a unified structure. Needed associated meta information is stored in the database. The email is deleted immediately afterwards.
In the process of creating the CSV, the parser is adding two additional parameters to each message: letter count and word count. These are later used for the visualizations.
A mail is send back to the address where the chat was received from. It contains a link to the visualization page.
Challenges
There were several challenges to overcome in the technical implementation of the application.
For example, soon after Chatvisualizer went online, WhatsApp started to export chats in zipped files, which forced us to implement an unzipping step into the workflow.
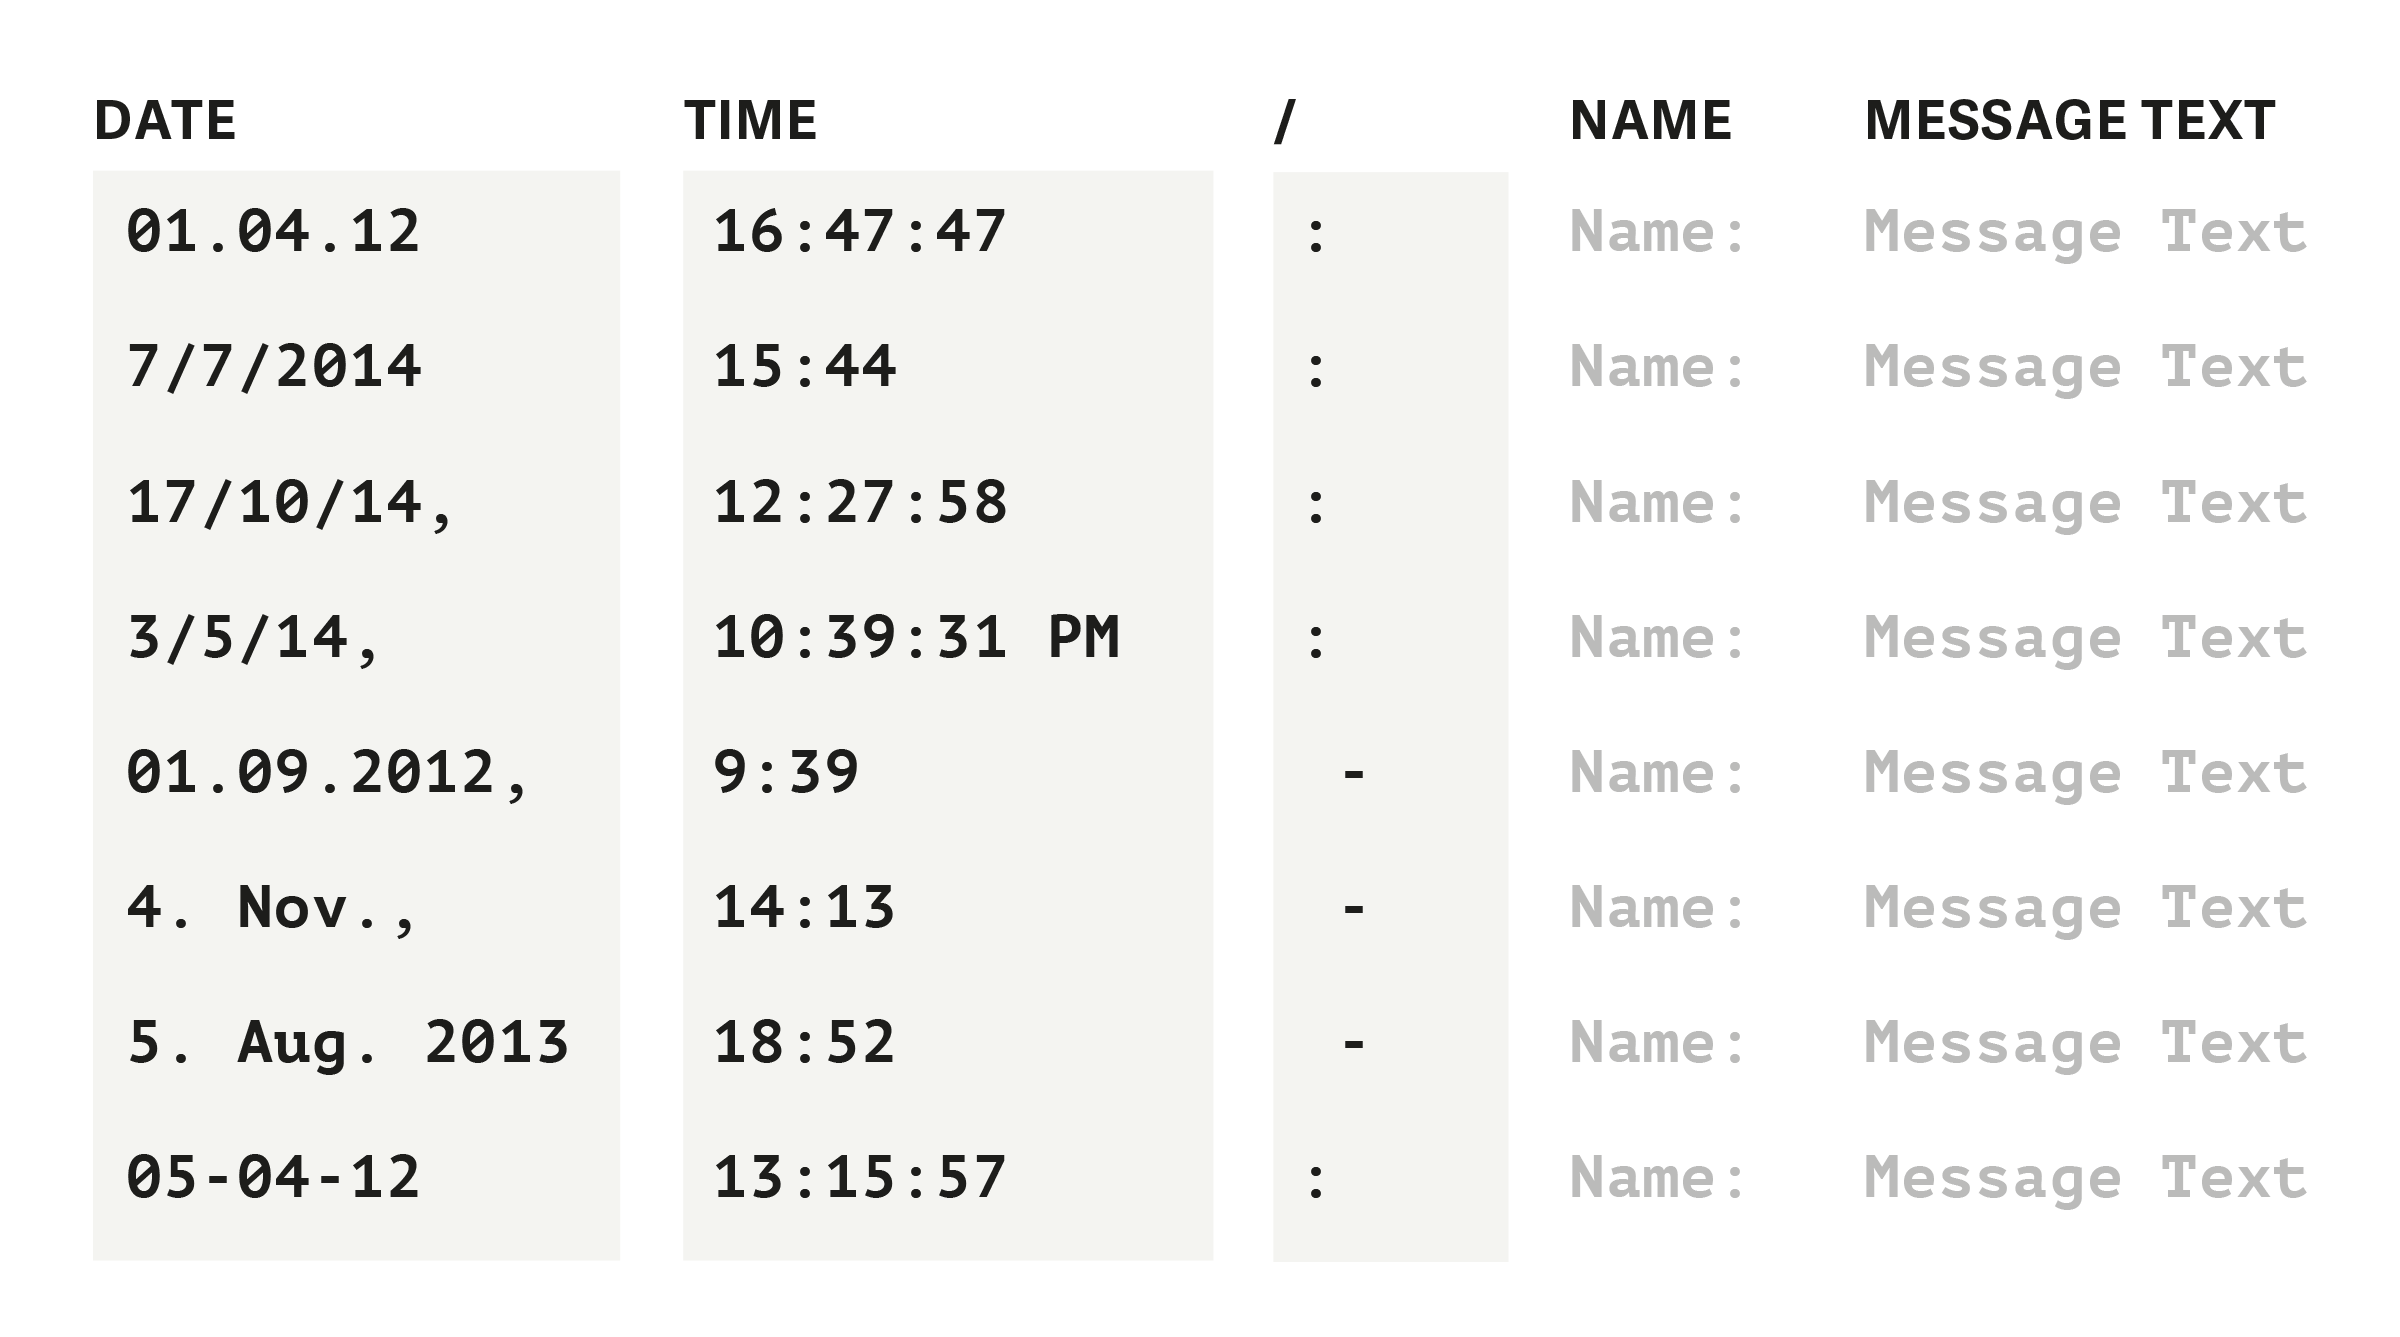
Nevertheless, the biggest challenge was the vast number of different date and time formats as well as variable divider characters that are used in the chat files WhatsApp is exporting – probably caused by different operating systems, languages and device specific settings. Sometimes the format even switches inside the chat files.
We did resolve this by constructing over 70 regex expressions being able to transform over 100 date and time formats into a unified timestamp.
This solution is very solid and errors in the conversion process are close to zero.
Frontend
The visualization page is highly based on D3.js. The library is loading the CSV file generated based on the exported chat file and produces several custom scripted SVG charts and figures.
Charts and figures are placed in a flexbox based grid. This granular setup makes it possible to adapt the visualization page to different chat parameters (like amount of chat members) and screen sizes.
Graphs and Numbers Data Visualization
A few parameters had to be considered when designing and building the visualization page:
- Flexible amounts of chat members (2 - 256)
- Flexible timespans of chats (some hours – multiple years)
- Unstable recognition of different data types (text, images, speech, location et cetera) depending on chat export file
- Different devices and screen sizes
This led to keeping Chatvisualizer's data visualizations simple for the first iteration.
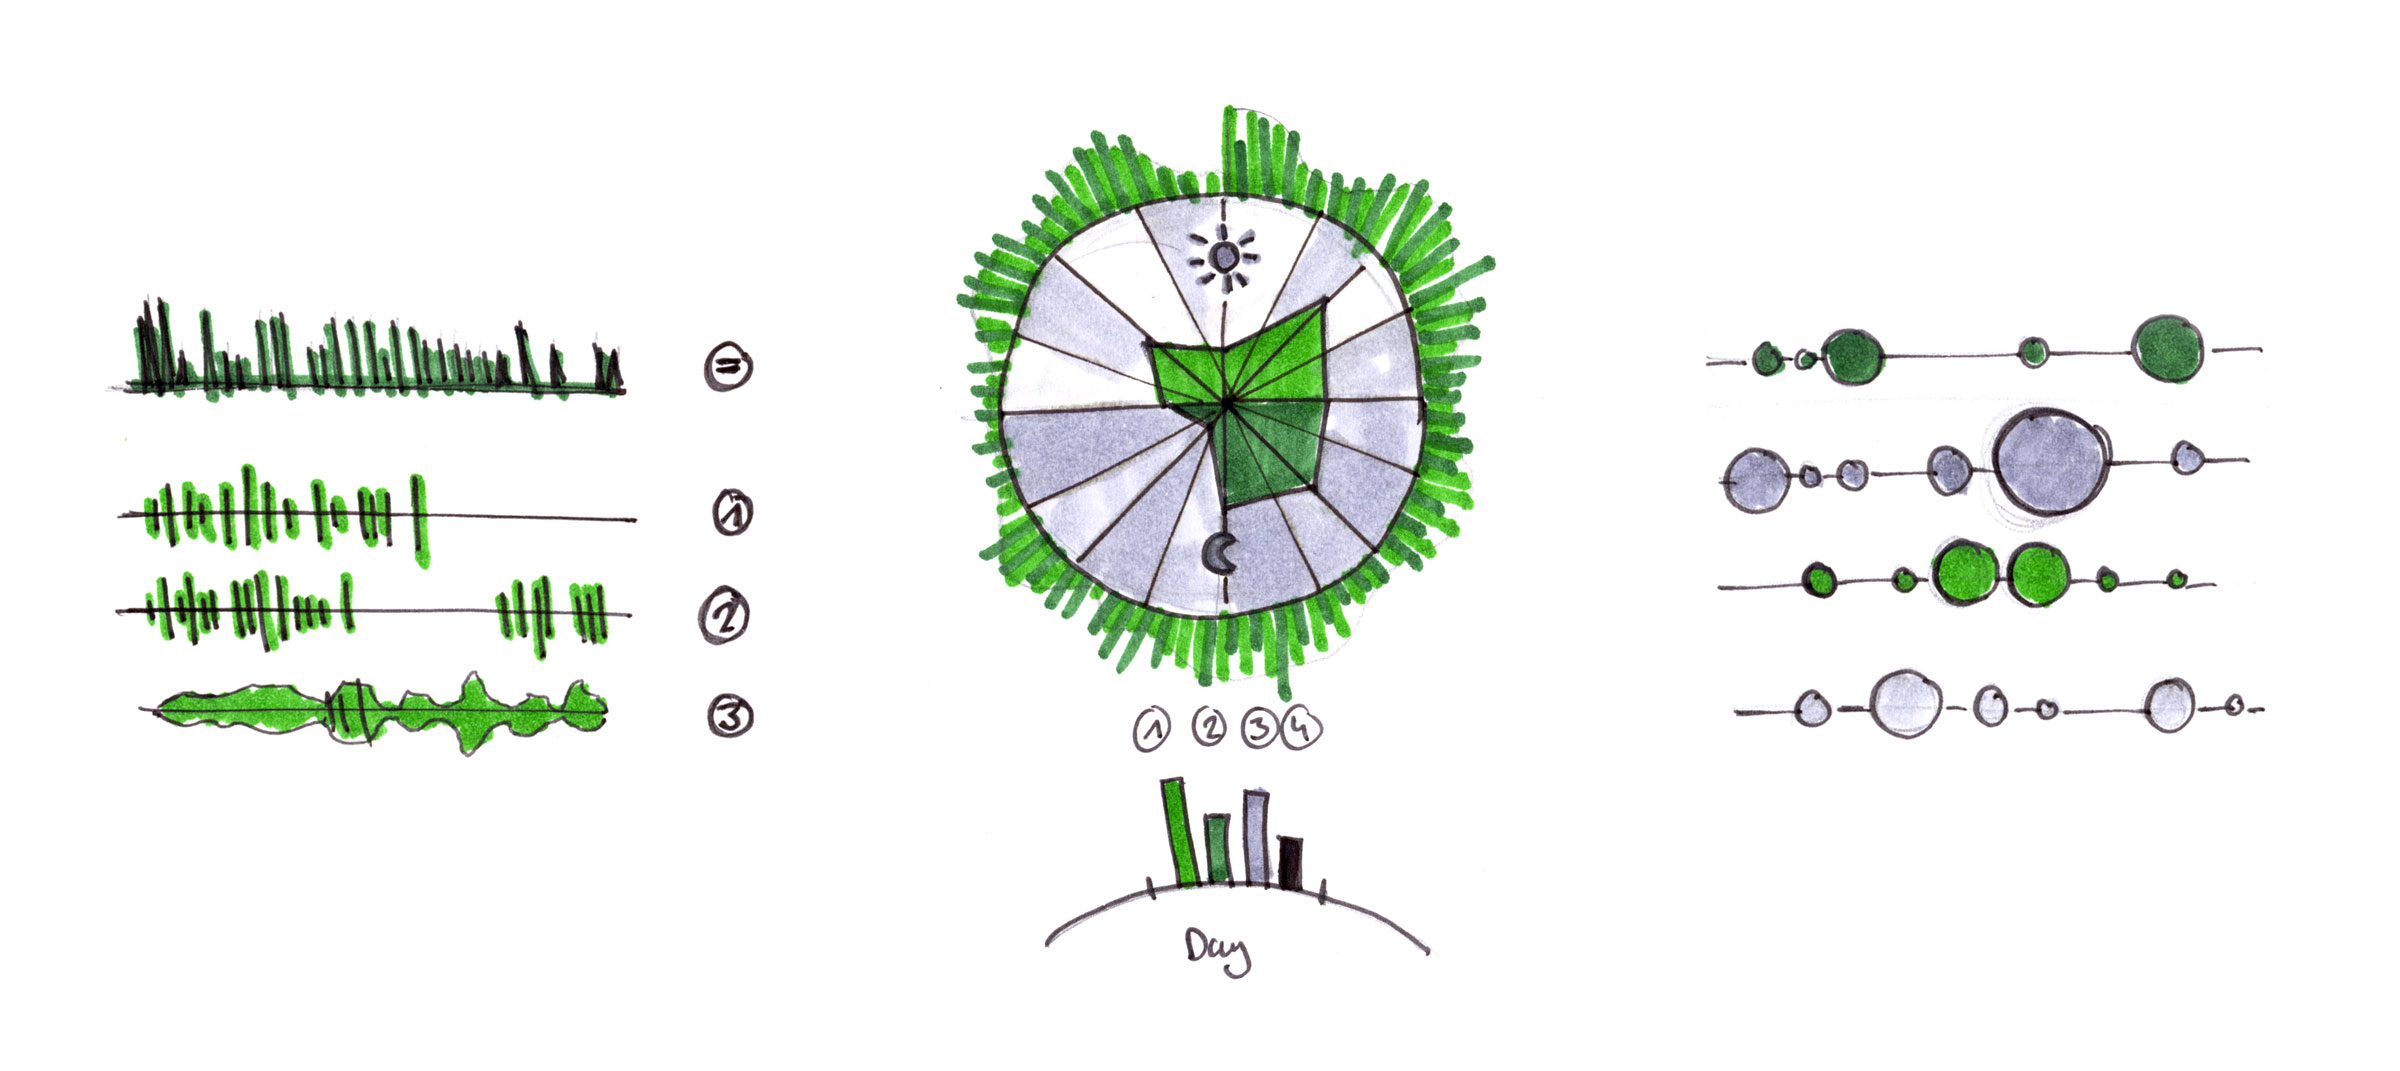
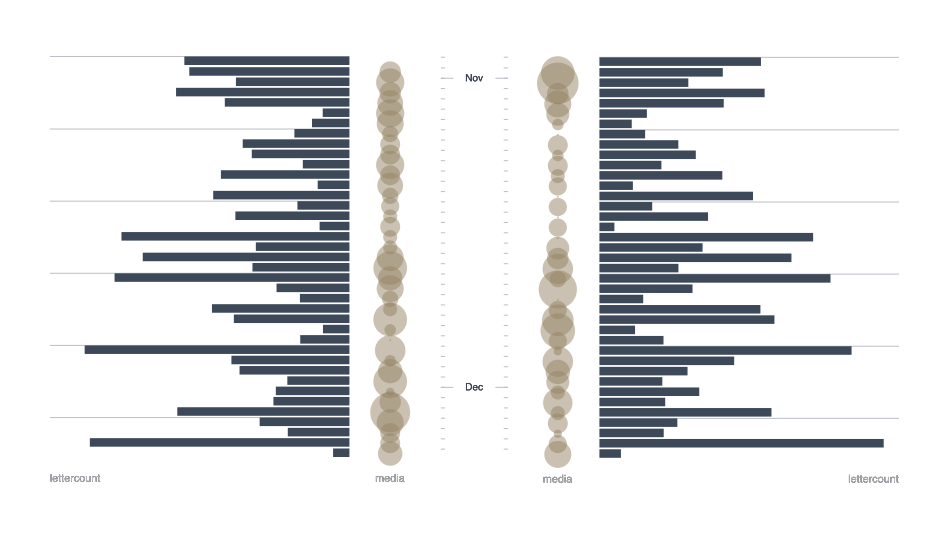
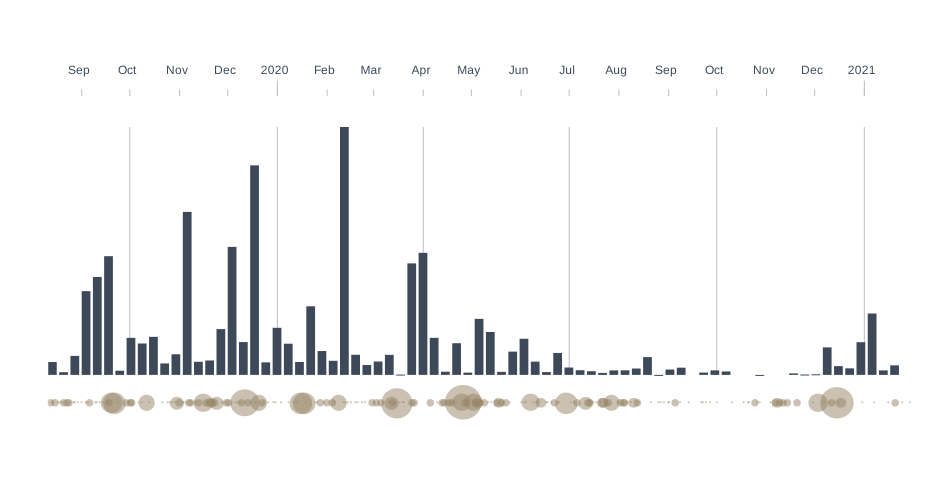
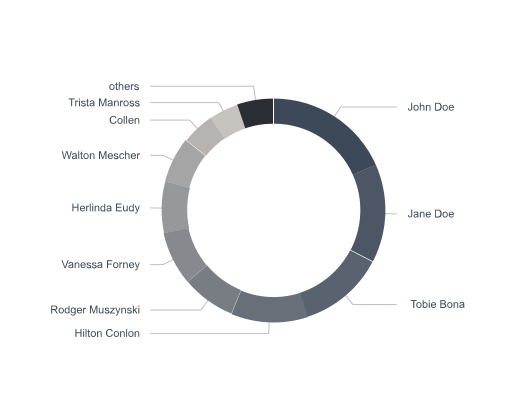
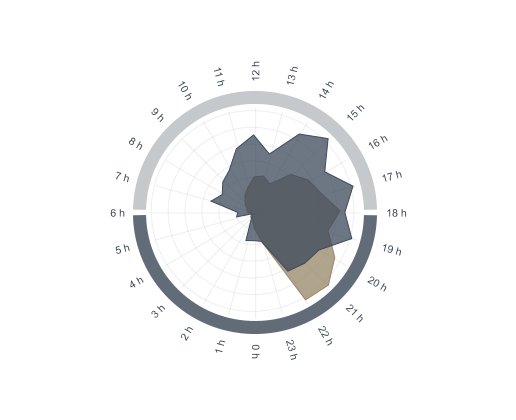
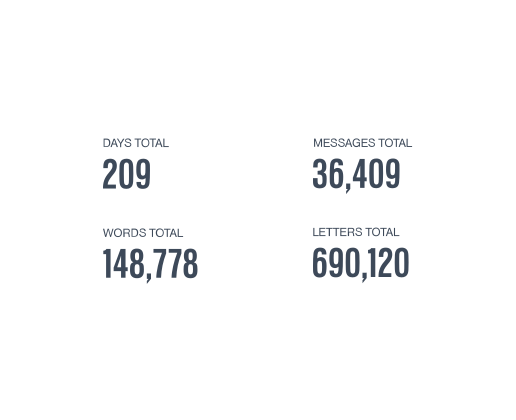
The main insight is displaying the amount of chatting and sharing data in a comprehensive timeline (or timelines, for more than two chat members). Activity over daytime can be inspected in a radar chart. A donut chart is visualizing the amount of chatting for each chat member based on letter counts.
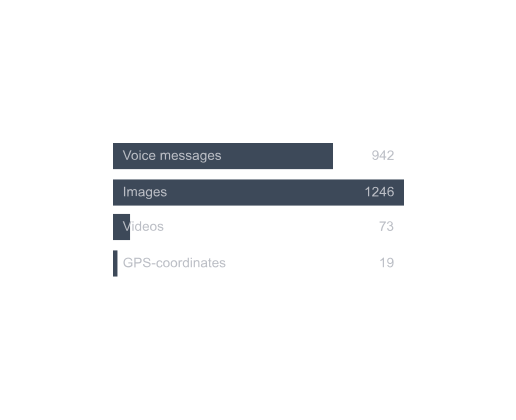
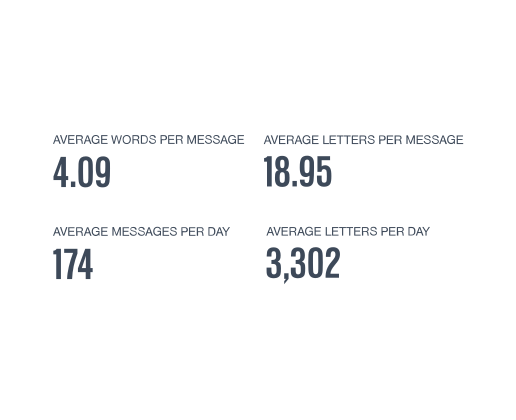
In the last section the most active day of the chat as well as some averages are shown. If possible, a bar chart is also displaying the amount of different data types sent in the chat.
Timeline – Two Person Chat
Timeline – Group Chat
Chatting Share
Daytime Activity
Files and Locations
Totals
Averages
Most active Day

Settings and Options
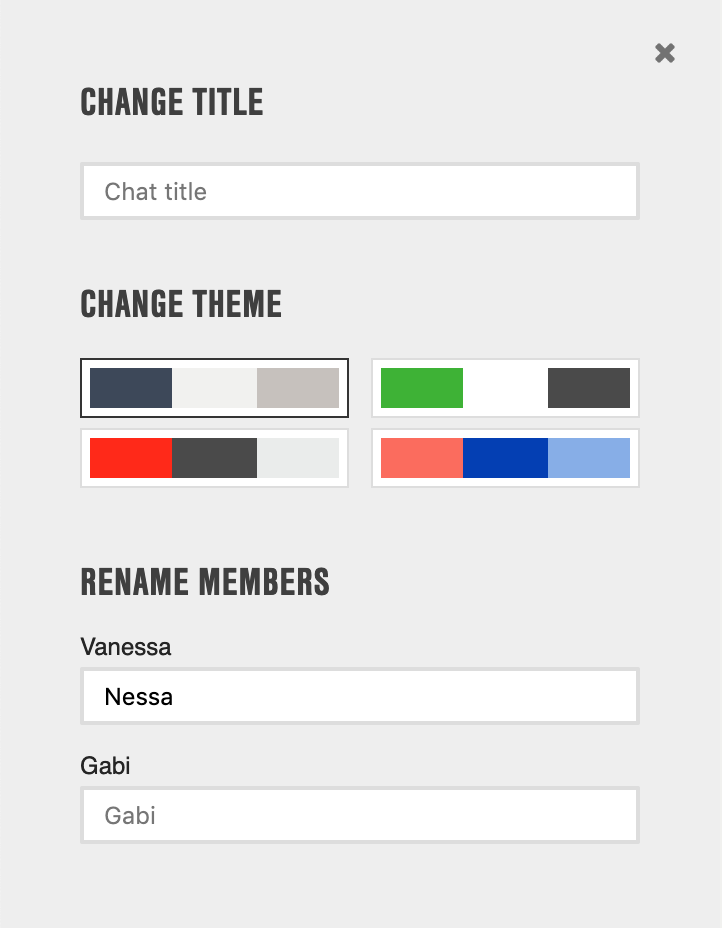
The settings panel is offering some ways to customize the data visualization:
- The title of the chat visualization can be changed to make it more personal.
- There are four different themes available for the visualization page which can be chosen in the settings panel.
- It is also possible to rename chat members, which comes in handy if members are only displayed with their mobile phone number.
CSV download
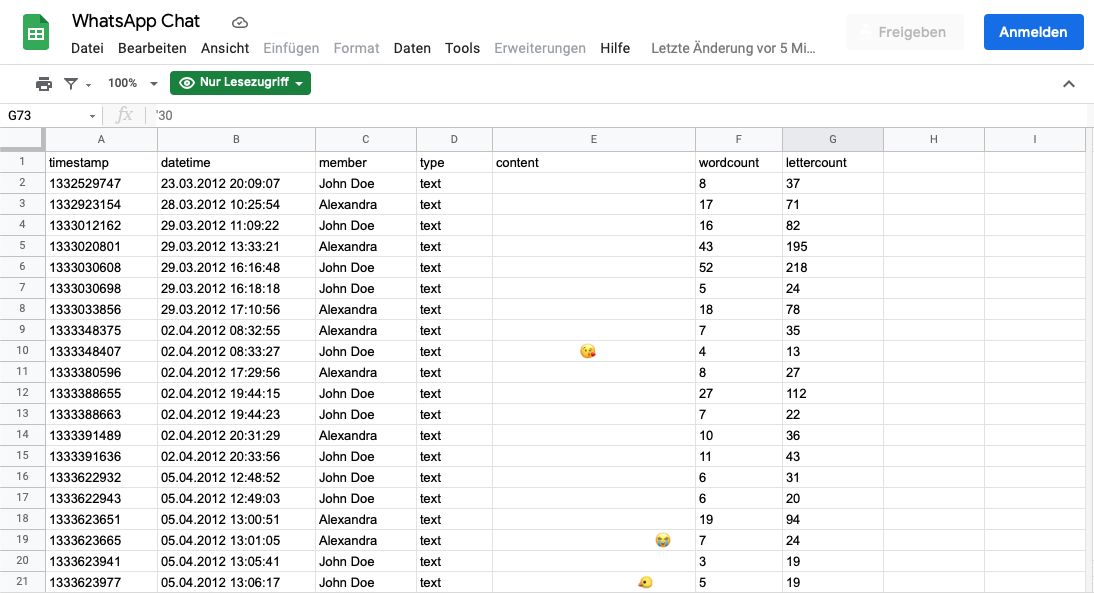
Chatvisualizer is offering a special feature: the generated unified tabular chat data is available for download.
This is introducing many possibilities, like combining multiple chats regardless of used mobile operating system and WhatsApp version and most importantly the creation of custom data analysis and visualizations.
Sharing knowledge Up.front meetup talk
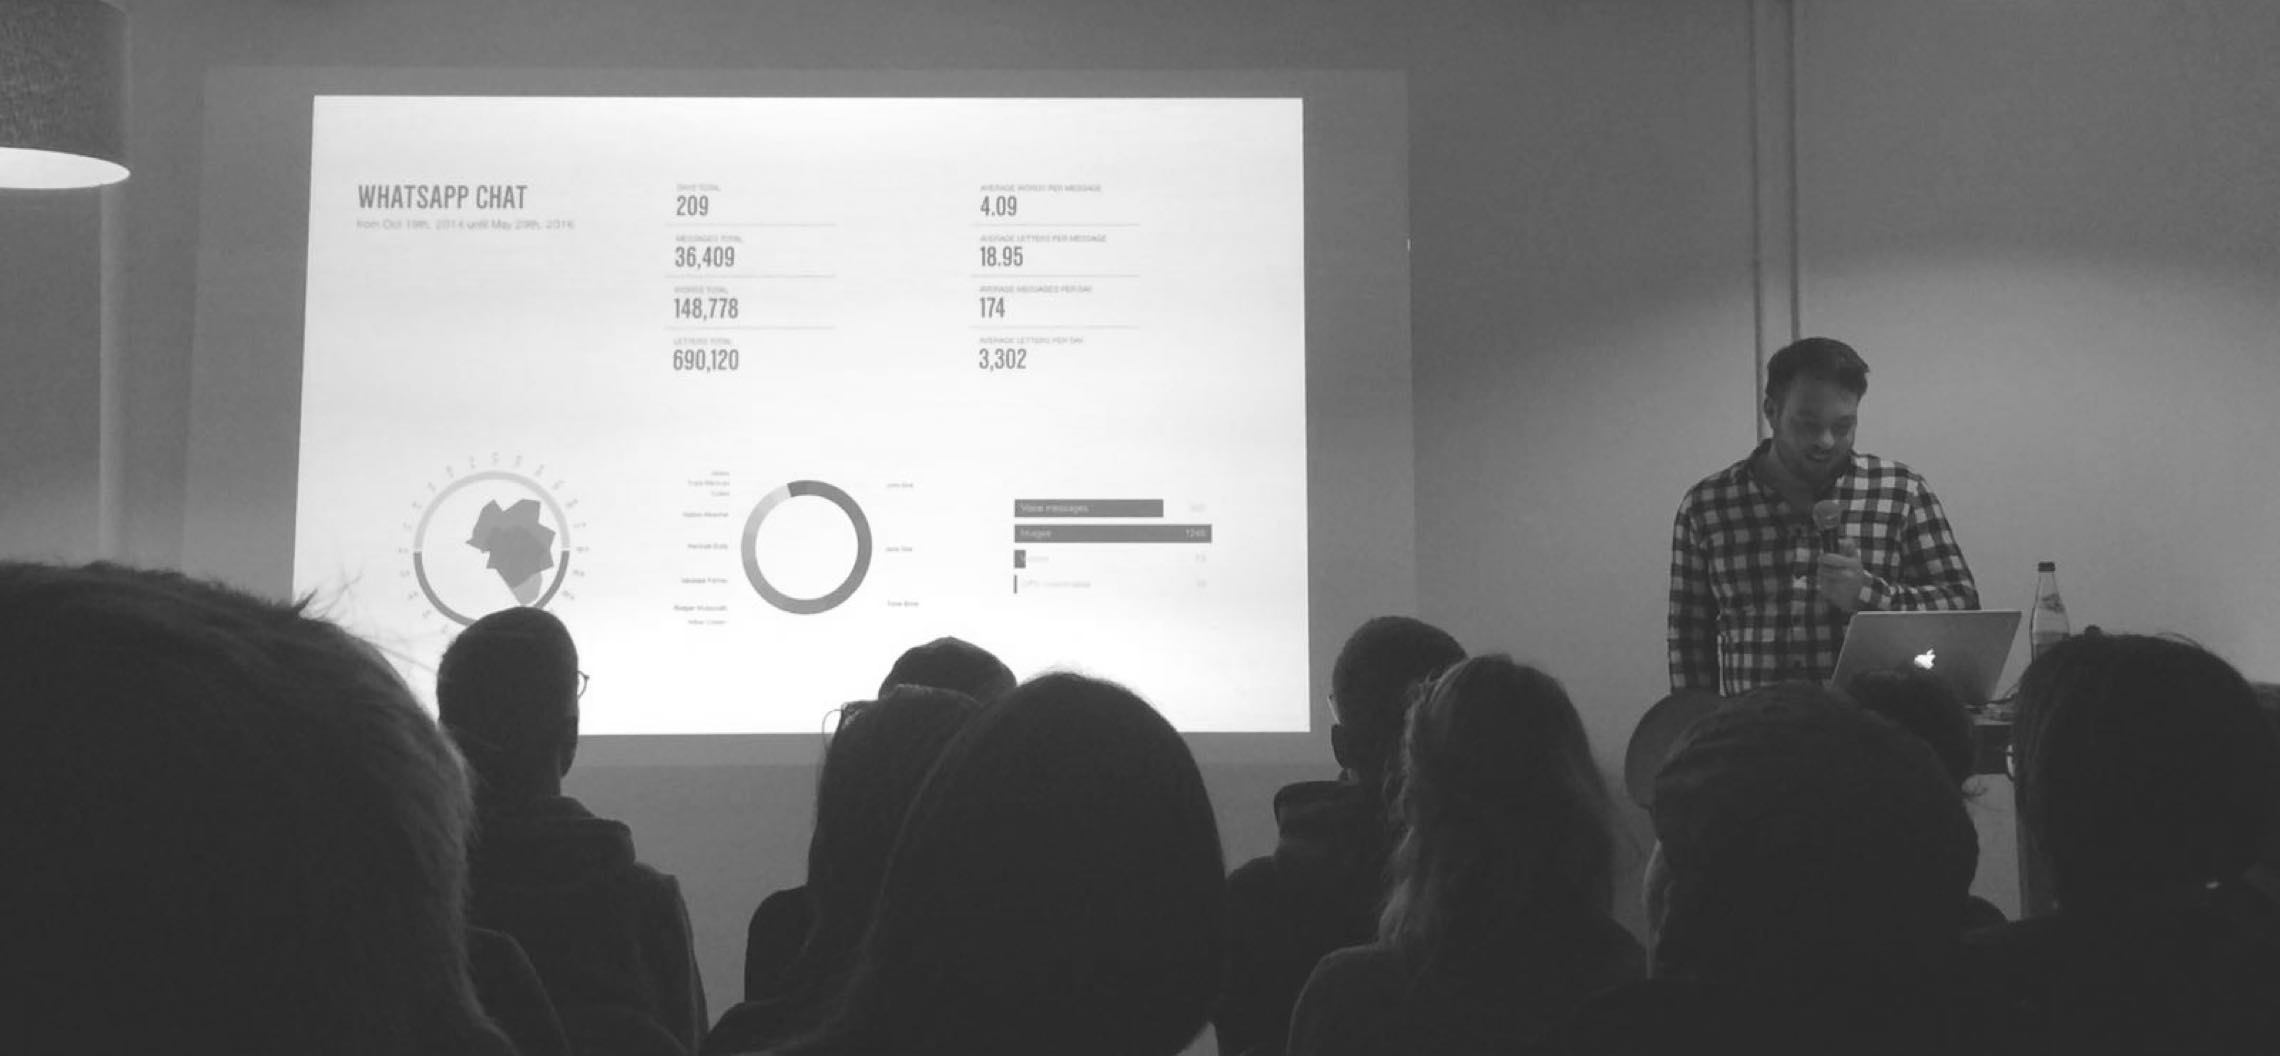
In October 2016 I held a talk at Up.front, a monthly meetup for the web design community in Berlin, about the Chatvisualizer project with a strong emphasis on the Lean Startup approach I used.
The talk – in particular its focus on Lean Startup – was very well perceived and led to several invitations to give it again at other events.
A PDF of my slides can be downloaded here.
Takeaways Learnings & Conclusion
Learning about the Lean Startup approach and putting it into practice in this project was an eye-opener for me. It really does help verifying and improving product concepts and their development. I definetely would recommend applying the methodology for suitable corporate and private projects.
From the technical side, Chatvisualizer was far more challenging than initially thought. It forced me to improve my web development, project management and most of all my data visualization skills. Maybe most importantly it taught me to make compromises in a "better done than perfect" way.
Chatvisualizer was shut down in mid 2025, since meanwhile a lot of other online services offering similar approaches emerged and keeping it updated with WhatsApp's development became too time-consuming.